Research topics & projects

Photodissociation regions

In the JWST era, the small spatial scales of the HI-to-H2 transition in photodissociation regions (PDRs) can be resolved. These objects and their sharp transitions in the physical conditions are used as a natural laboratory to test our theoretical and observational knowledge of the physical processes that are driven by strong UV radiation fields and other feedback effects of young stars.

Image credit: Habart, Peeters, Berné et al. (2023)

Aromatic emission bands and more

The small carbonaceous dust grains and molecules in these objects are pumped by UV photons. The resulting vibrational cascades result in numerous infrared emission bands, which are particularly bright in PDRs. By studying the reponse of the spectral profiles and intensity ratios of the emission as observed with JWST, I aim to characterize both the emission carriers themselves and the environment in which they reside.

My latest work has focused on the northwest PDR of the Iris nebula, making use of the deep and spatially resolved JWST spectroscopy.

The Iris nebula (NGC 7023)

My work on the Iris nebular is part of the "PDR-GTO" collaboration (GTO-1192), a JWST Guaranteed Time Observation program that observed the Horsehead and Iris Nebula PDRs.

See recent publication

The Orion Bar and PDRs4All

The PDRs4All (pdrs4all.org) Early Release Science JWST program (PI: Berné, Habart, Peeters) observed the very bright Orion Bar PDR, resulting in extremely high quality data that brought forth an extensive series of publication.

My work within this collaboration: PDRs4All VIII, the mid-infrared lines overview, and PDRs4All XVI, which presents the development of the "PDR pack" for PAHFIT, to enable a detailed spectral decomposition of the IR emission bands.

Software

  • PDRsAll data reduction package

    Reduce JWST IFU data for extended sources. Wraps around the official jwst Python package, with different settings, and tools for association generation, parallel processing. Postprocessing steps include WCS correction and building alternative data cubes.

  • PAHFIT & PAHFITcube

    I have been using and contributing to PAHFIT to decompose JWST spectra and characterize emission band profiles (see also research highlight). I also created an additional collection of tools called PAHFITcube, to fit IFU datacubes and visualize the results in a convenient and consistent way.

  • SKIRT

    3D Monte Carlo Dust Radiative Transfer.

    I made contributions to SKIRT during my Master's project, implementing data parallelization for the multi-processing mode with the Message Passing Interface.

    RADAGAST

    Module developed as my Ph.D project. It implements the typical physical processes in PDRs, given a certain radiation field and certain dust properties. RADAGAST was then coupled to the SKIRT radiative transfer model.

Recent publication

JWST observations of photodissociation regions. IV. Carbonaceous emission band sub-components in NGC 7023 have distinct spatial distributions

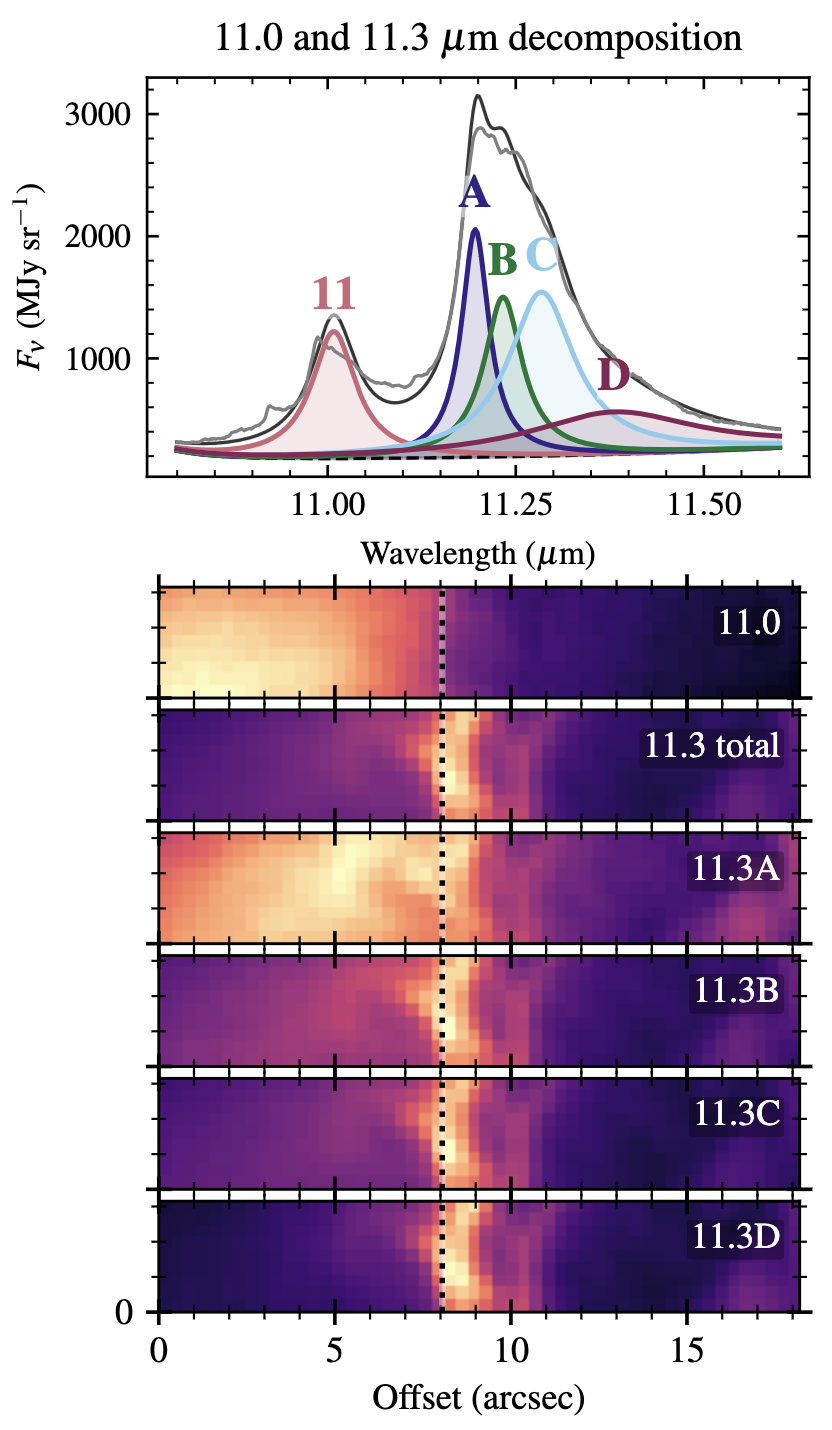
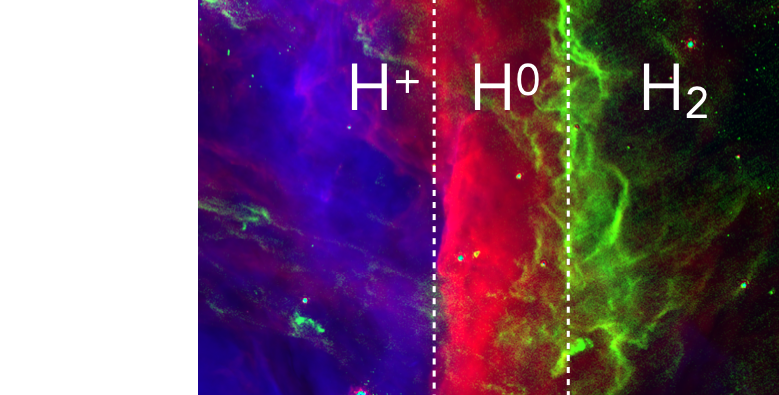
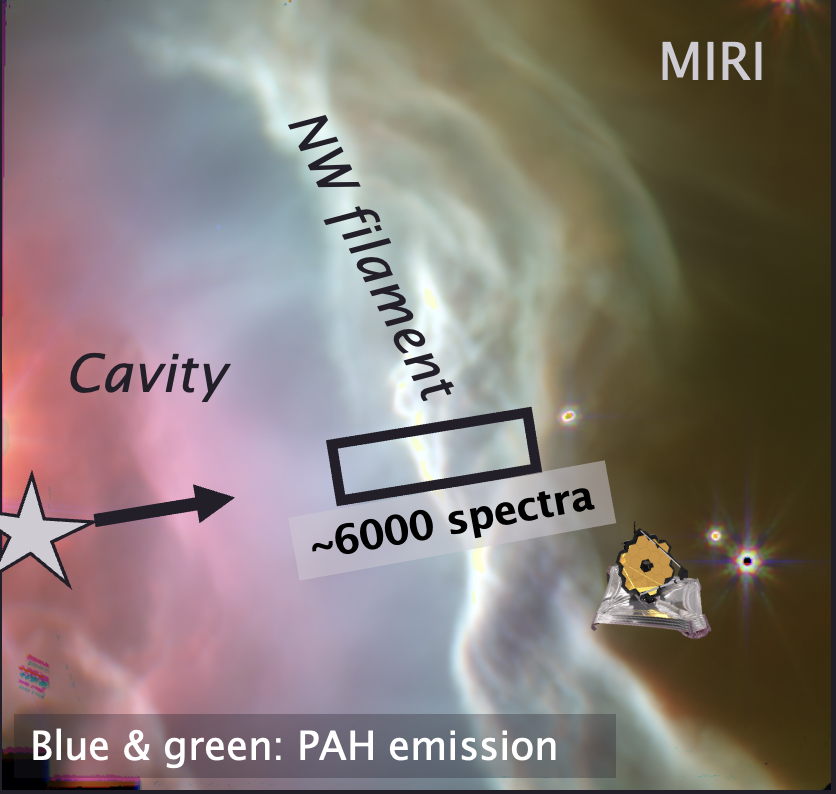
We analyze JWST spectroscopy of the northwest filament of NGC7023, where the relatively soft radiation field results in a photodissociation region with an extended atomic hydrogen region, and strongly pronounced variations of the carbonaceous emission band profiles. We focus on the 16.4 and 17.4 um bands and their relation to the main bands at 3.3, 3.4, 5.2, 5.7, 6.2, 7.7, 8.6, 11.3, and 12.7 um, and aim to identify which bands and sub-features originate from co-spatial emission carriers. We apply a PAHFIT spectral decomposition to measure the emission bands and their individual sub-components, and produce maps that spatially resolve the main dissociation front (DF1). Nearly all emission maps peak at DF1, while the relative intensity in the atomic hydrogen region (ATM) varies strongly. We classify the features into spatial distribution types based on the intensity ratio in ATM relative to DF1. Most bands are of type I (low ATM/DF1; 3.3, 3.4, 5.2, 5.7, 11.3 um) or II (medium ATM/DF1; 16.2, 7.7, 8.6, 12.7, 16.4 um), while only few are of type III (high ATM/DF1; 11.0, 17.4 um). A breakdown of the 5.7, 7.7, 11.3 and 12.7 um bands into blue and red sub-components reveals that contributions on the blue side are of type III, while those on the red side are of type I or II. These strongly differing spatial distributions reveal that at least two different populations contribute to the 16-18 um range, and that these populations are also connected to the profiles of the 5.7, 7.7, 11.3, and 12.7 um bands. The maps further indicate a continued evolution of these profiles toward the central cavity of NGC7023, where fullerene emission (C60) was previously detected. We speculate that the population of emission carriers could be in an intermediate photochemical evolution stage that precedes fullerene formation.